June 7, 2013
May 2013 Unemployment
May 2013
Unemployment Rate: 7.6 percent
Unemployed Americans: 11.8 million
“Real” Unemployment
- The “real” unemployment or U-6 rate is 13.8 percent for May 2013. This is the total percentage of unemployed and underemployed workers.
- The “real” number of unemployed Americans is 21.9 million. These are people who are unemployed (11.8 million), want work but have stopped searching for a job (2.2 million), or are working part time because they can’t find full time employment (7.9 million).
Labor Force Participation
- The labor force participation rate is 63.4 percent, up 0.1 from last month, when it reached its lowest level since May 1979.
- If the labor force participation rate were the same as when the President took office, the unemployment rate would be 10.7 percent.
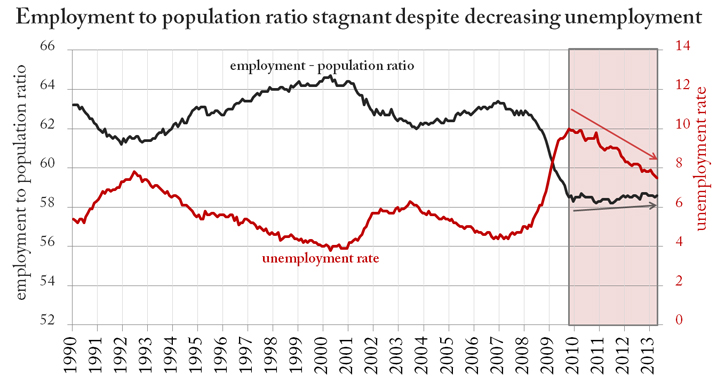
- The share of American adults with jobs in April was 58.6 percent, roughly the same for more than three years. This is approximately five percentage points below its prerecession peak.
- As explained by Edward Lazear, chairman of the Council of Economic Advisors under President Bush, historically the relation between unemployment and employment has been inverse. As the employment-to-population ratio rises, the unemployment rate falls, and vice versa. This decades-long trend has been broken following the latest recession. Over the last three and a half years, while the unemployment rate has fallen, the employment-to-population ratio has remained steady at around 58.5 percent. So while the net number of jobs over this period has increased, so too has the size of the working population. At this pace, U.S. job growth is only slightly better than what is takes to keep the employed percentage of the working-age population steady, causing the available number of jobs to continue to seem scarce.

- As noted in the Wall Street Journal, at “the present slow pace of job growth, it will require more than a decade to get back to full employment defined by prerecession standards.”
- The number of long-term unemployed spiked to 45 percent in April 2010 and again in March 2011, and continues to remain above 37 percent. During the 1980s, when our country faced a similar recessionary period, the proportion of long-term unemployed never exceeded 27 percent.
Employment
- The Department of Labor reported an unemployment rate of 7.6 percent for May 2013, an increase of 0.1 percentage points, and an increase of 175,000 nonfarm jobs. Employment figures for March were revised from 138,000 to 142,000 jobs created and for April from 165,000 to 149,000 new jobs. Combined, employment gains in March and April were 12,000 less than previously reported.
- President Obama promised an unemployment rate of 5.2 percent by this time.
- Concern has been raised that despite positive reports in other areas of the economy, job growth continues to remain sluggish. In 2012, the economy added an average of 262,000 jobs a month. In 2013, the economy has added an average of 189,000 jobs per month, and employment growth has averaged 172,000 per month over the past 12 months.
- Employment increased in professional and business services (+57,000), food services and drinking places (+38,000), retail trade (+28,000) and health care (+11,000). Employment in manufacturing declined (-8,000) and government declined (-3,000). Within government, federal employment fell by 14,000.
Weeks, Hours & Wages
- The number of Americans searching for work for more than 27 weeks is 4.4 million, this represents 37.3 percent of all unemployed.
- The average work week for private nonfarm employees increased by 0.1 hour to 34.5 hours.
- The average hourly private nonfarm payroll increased by 2 cents to $23.89. Year over year hourly earnings have risen just 1.8 percent. Consumer Price Index is up 1.6 percent.
Next Article Previous Article
