August 2, 2013
July Unemployment Report
July 2013
Unemployment Rate: 7.4 percent
Unemployed Americans: 11.5 million
“Real” Unemployment
- The “real” unemployment or U-6 rate is 14.0 percent for July 2013, a decrease of 0.3 percentage points. This is the total percentage of unemployed and underemployed workers.
- The “real” number of unemployed Americans is 22.1 million. These are people who are unemployed (11.5 million), want work but have stopped searching for a job (2.4 million), or are working part time because they can’t find full time employment (8.2 million).
- The number of Americans finding part-time work has increased over the year. Roughly four times as many workers are finding part-time work as opposed to full-time jobs. This is the opposite of what occurred last year.
Labor Force Participation
- The labor force participation rate is 63.4 percent, down 0.1 from June , and up only 0.1 from April, when it reached its lowest level since May 1979.
- If the labor force participation rate were the same as when President Obama took office, the unemployment rate would be 10.6 percent.
- The share of American adults with jobs in July was 58.7 percent, roughly the same for more than three years. This is approximately five percentage points below its prerecession peak.
- The number of long-term unemployed spiked to 45 percent in April 2010 and again in March 2011, and is currently 37 percent of the unemployed, up 0.3 percent from last month. During the 1980s, when our country faced a similar recessionary period, the proportion of long-term unemployed never exceeded 27 percent.
- There were 988,000 workers in July categorized as marginally attached to the workforce, an increase of 136,000 from a year earlier. This counts those who are not currently looking for work because they believe no jobs are available for them.
Employment
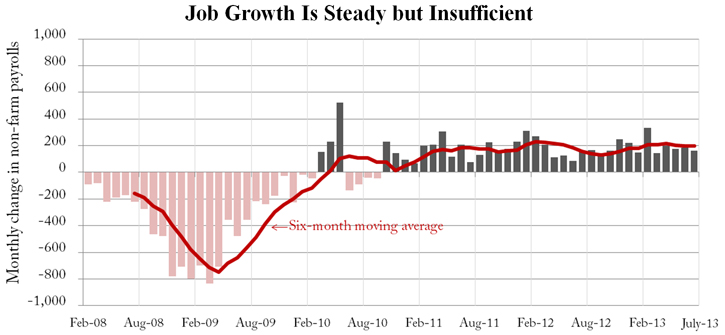
- The Department of Labor reported an unemployment rate of 7.4 percent for July 2013, down 0.2 percent from June, and an increase of 162,000 nonfarm jobs. The last two months were revised down 26,000 jobs. May employment figures were revised from 195,000 to 176,000 jobs created, and June figures were revised from 195,000 to 188,000 new jobs.
- President Obama promised a “natural unemployment” rate of 5.0 percent by this time.
- Job growth continues to remain sluggish. In 2012, the economy added an average of 262,000 jobs a month. In 2013, the economy has added an average of 192,400 jobs per month, and employment growth has averaged 190,000 jobs per month over the past 12 months.

- Employment increased in retail trade (+47,000), leisure and hospitality (+38,000), financial services (+15,000), and wholesale trade (+14,000). Employment in construction was down by 6,000 jobs; federal employment fell by 2,000; and transit and ground transportation lost 8,600 jobs last month.
Weeks, Hours & Wages
- The number of Americans searching for work for more than 27 weeks is 4.2 million.
- The average hourly private nonfarm payroll decreased by 2 cents to $23.98. Year over year hourly earnings have risen just 1.8 percent. Barely accounting for inflation as the Consumer Price Index is up 1.8 percent year over year.
- The average work week for private nonfarm employees was 34.4 hours, a decrease of 0.1 hour compared to June. Lower wages combined with fewer hours mean less money in consumers' pockets.
Next Article Previous Article
